Data Visualisation: University of the arts London (UAL)
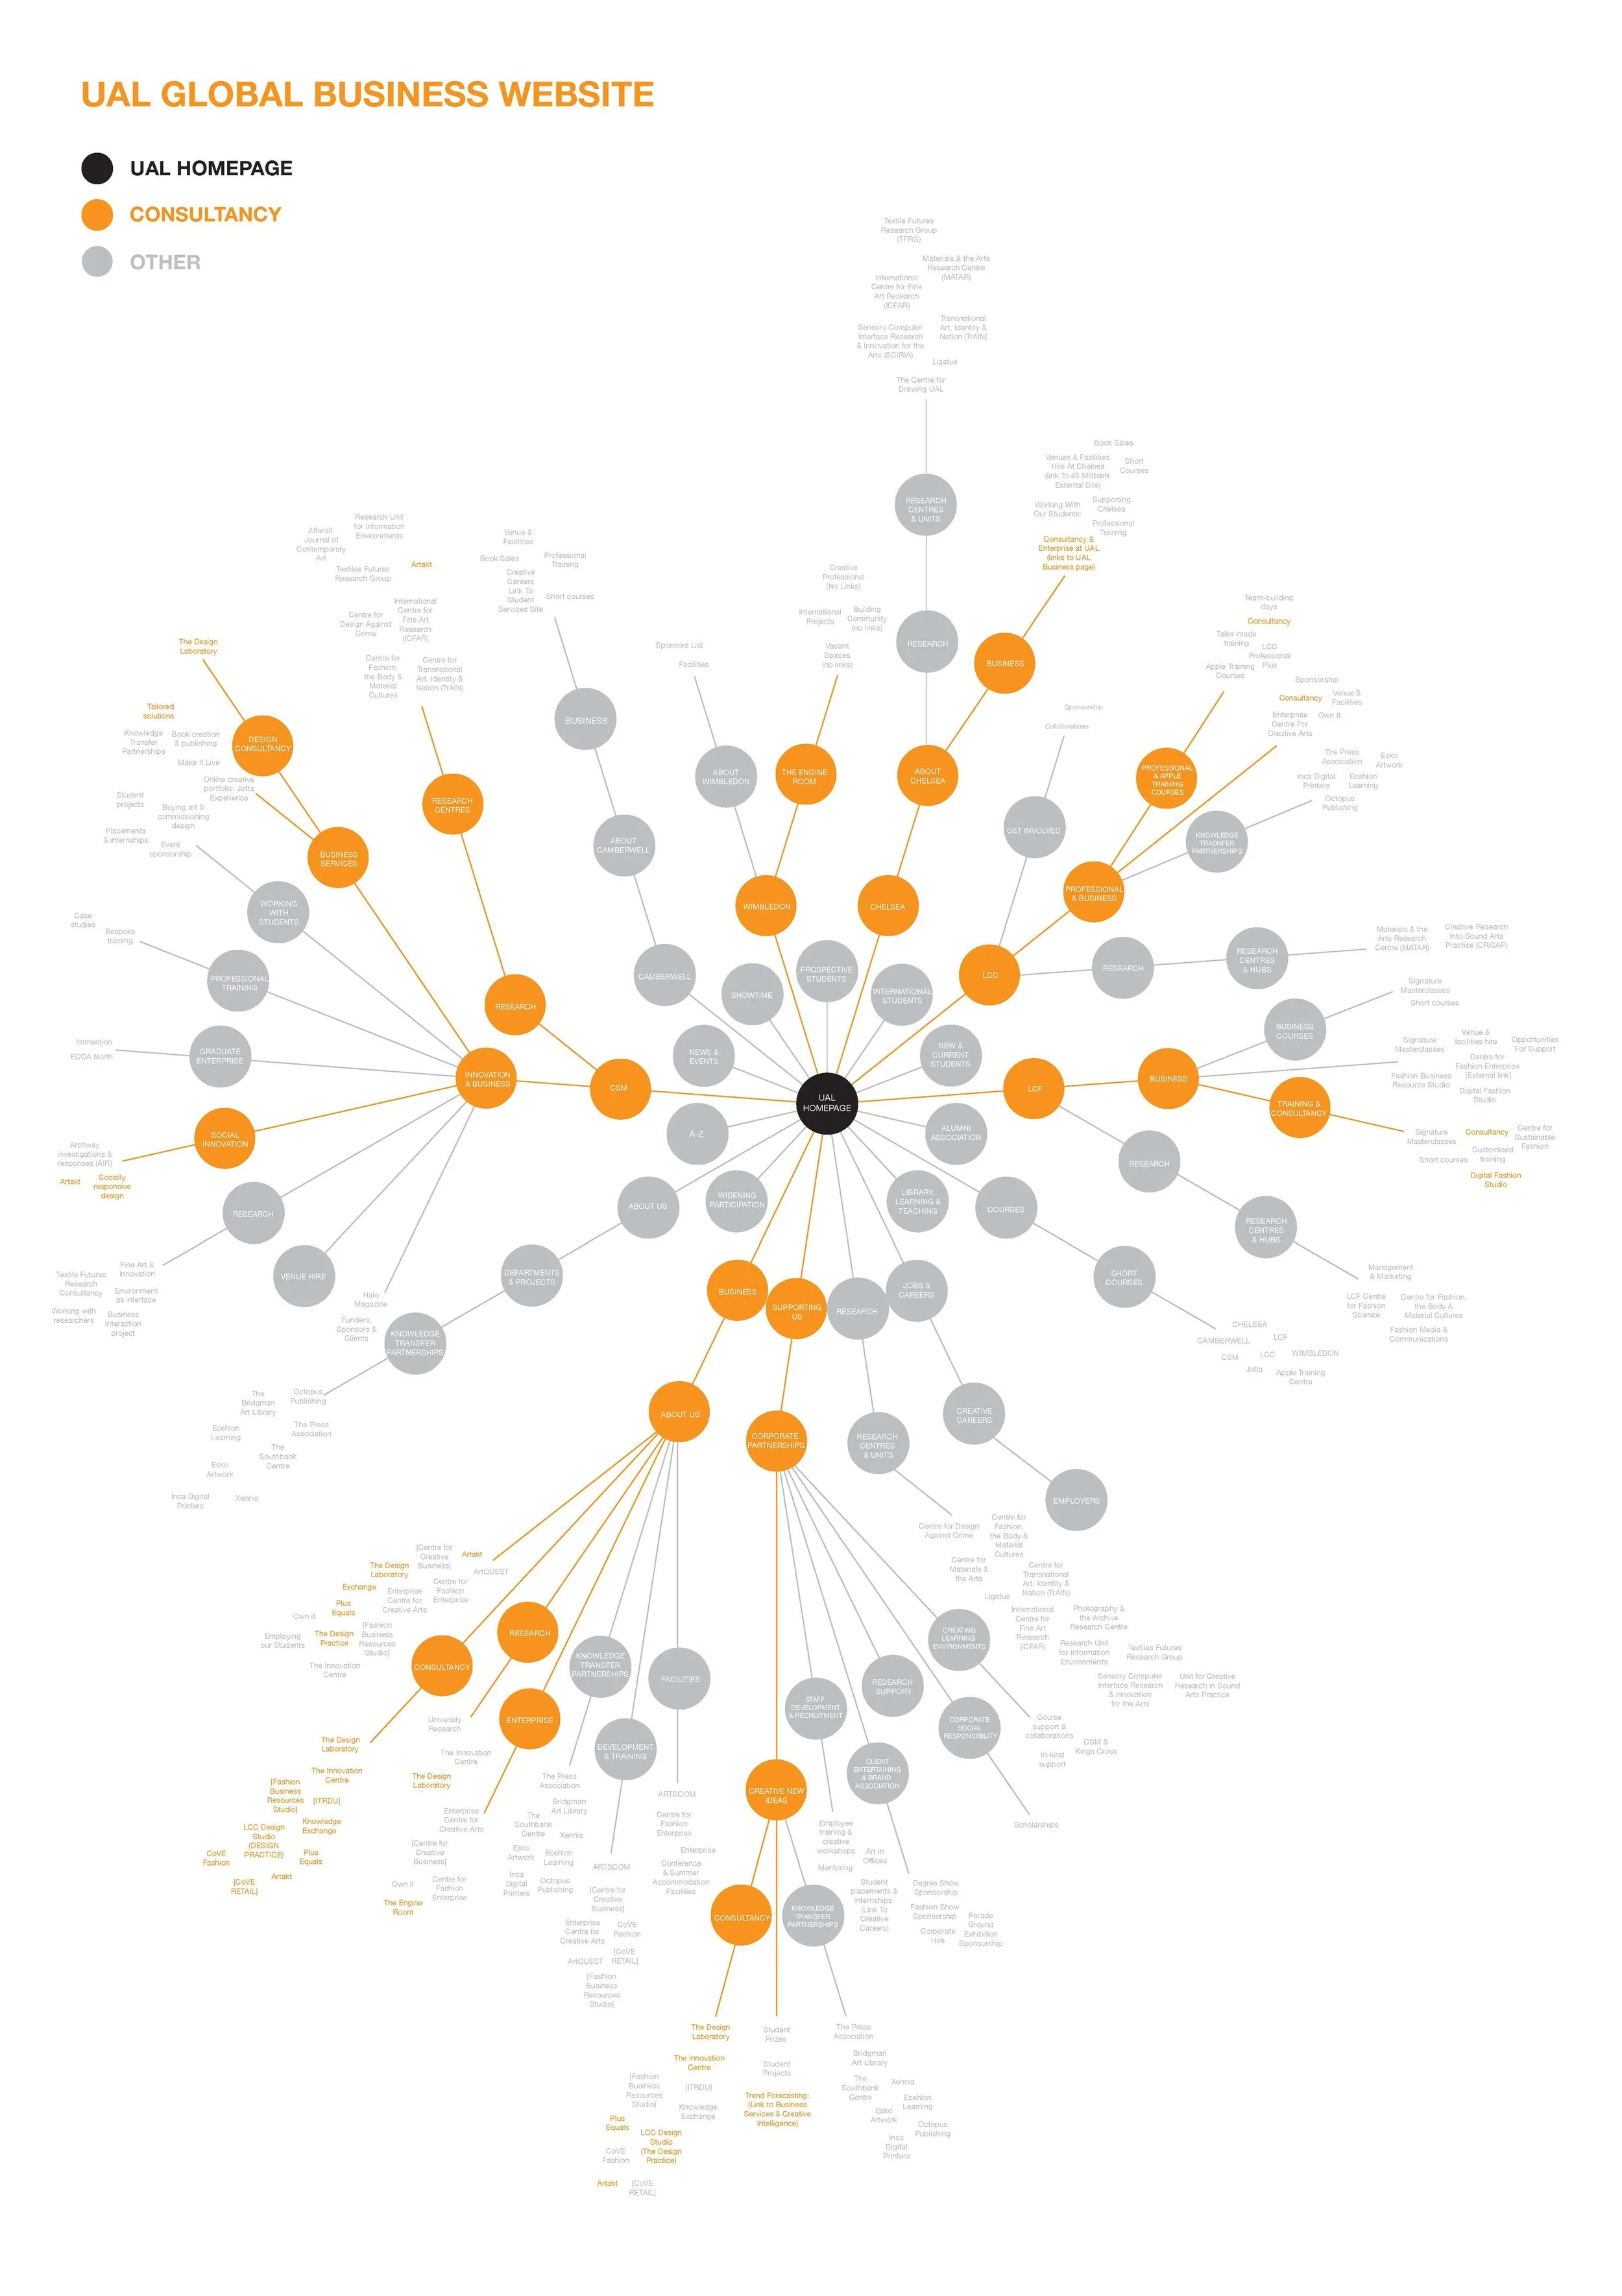
STAGE 1
Mapping out the information on the UAL Global Business Website, then creating colour-coded categories.
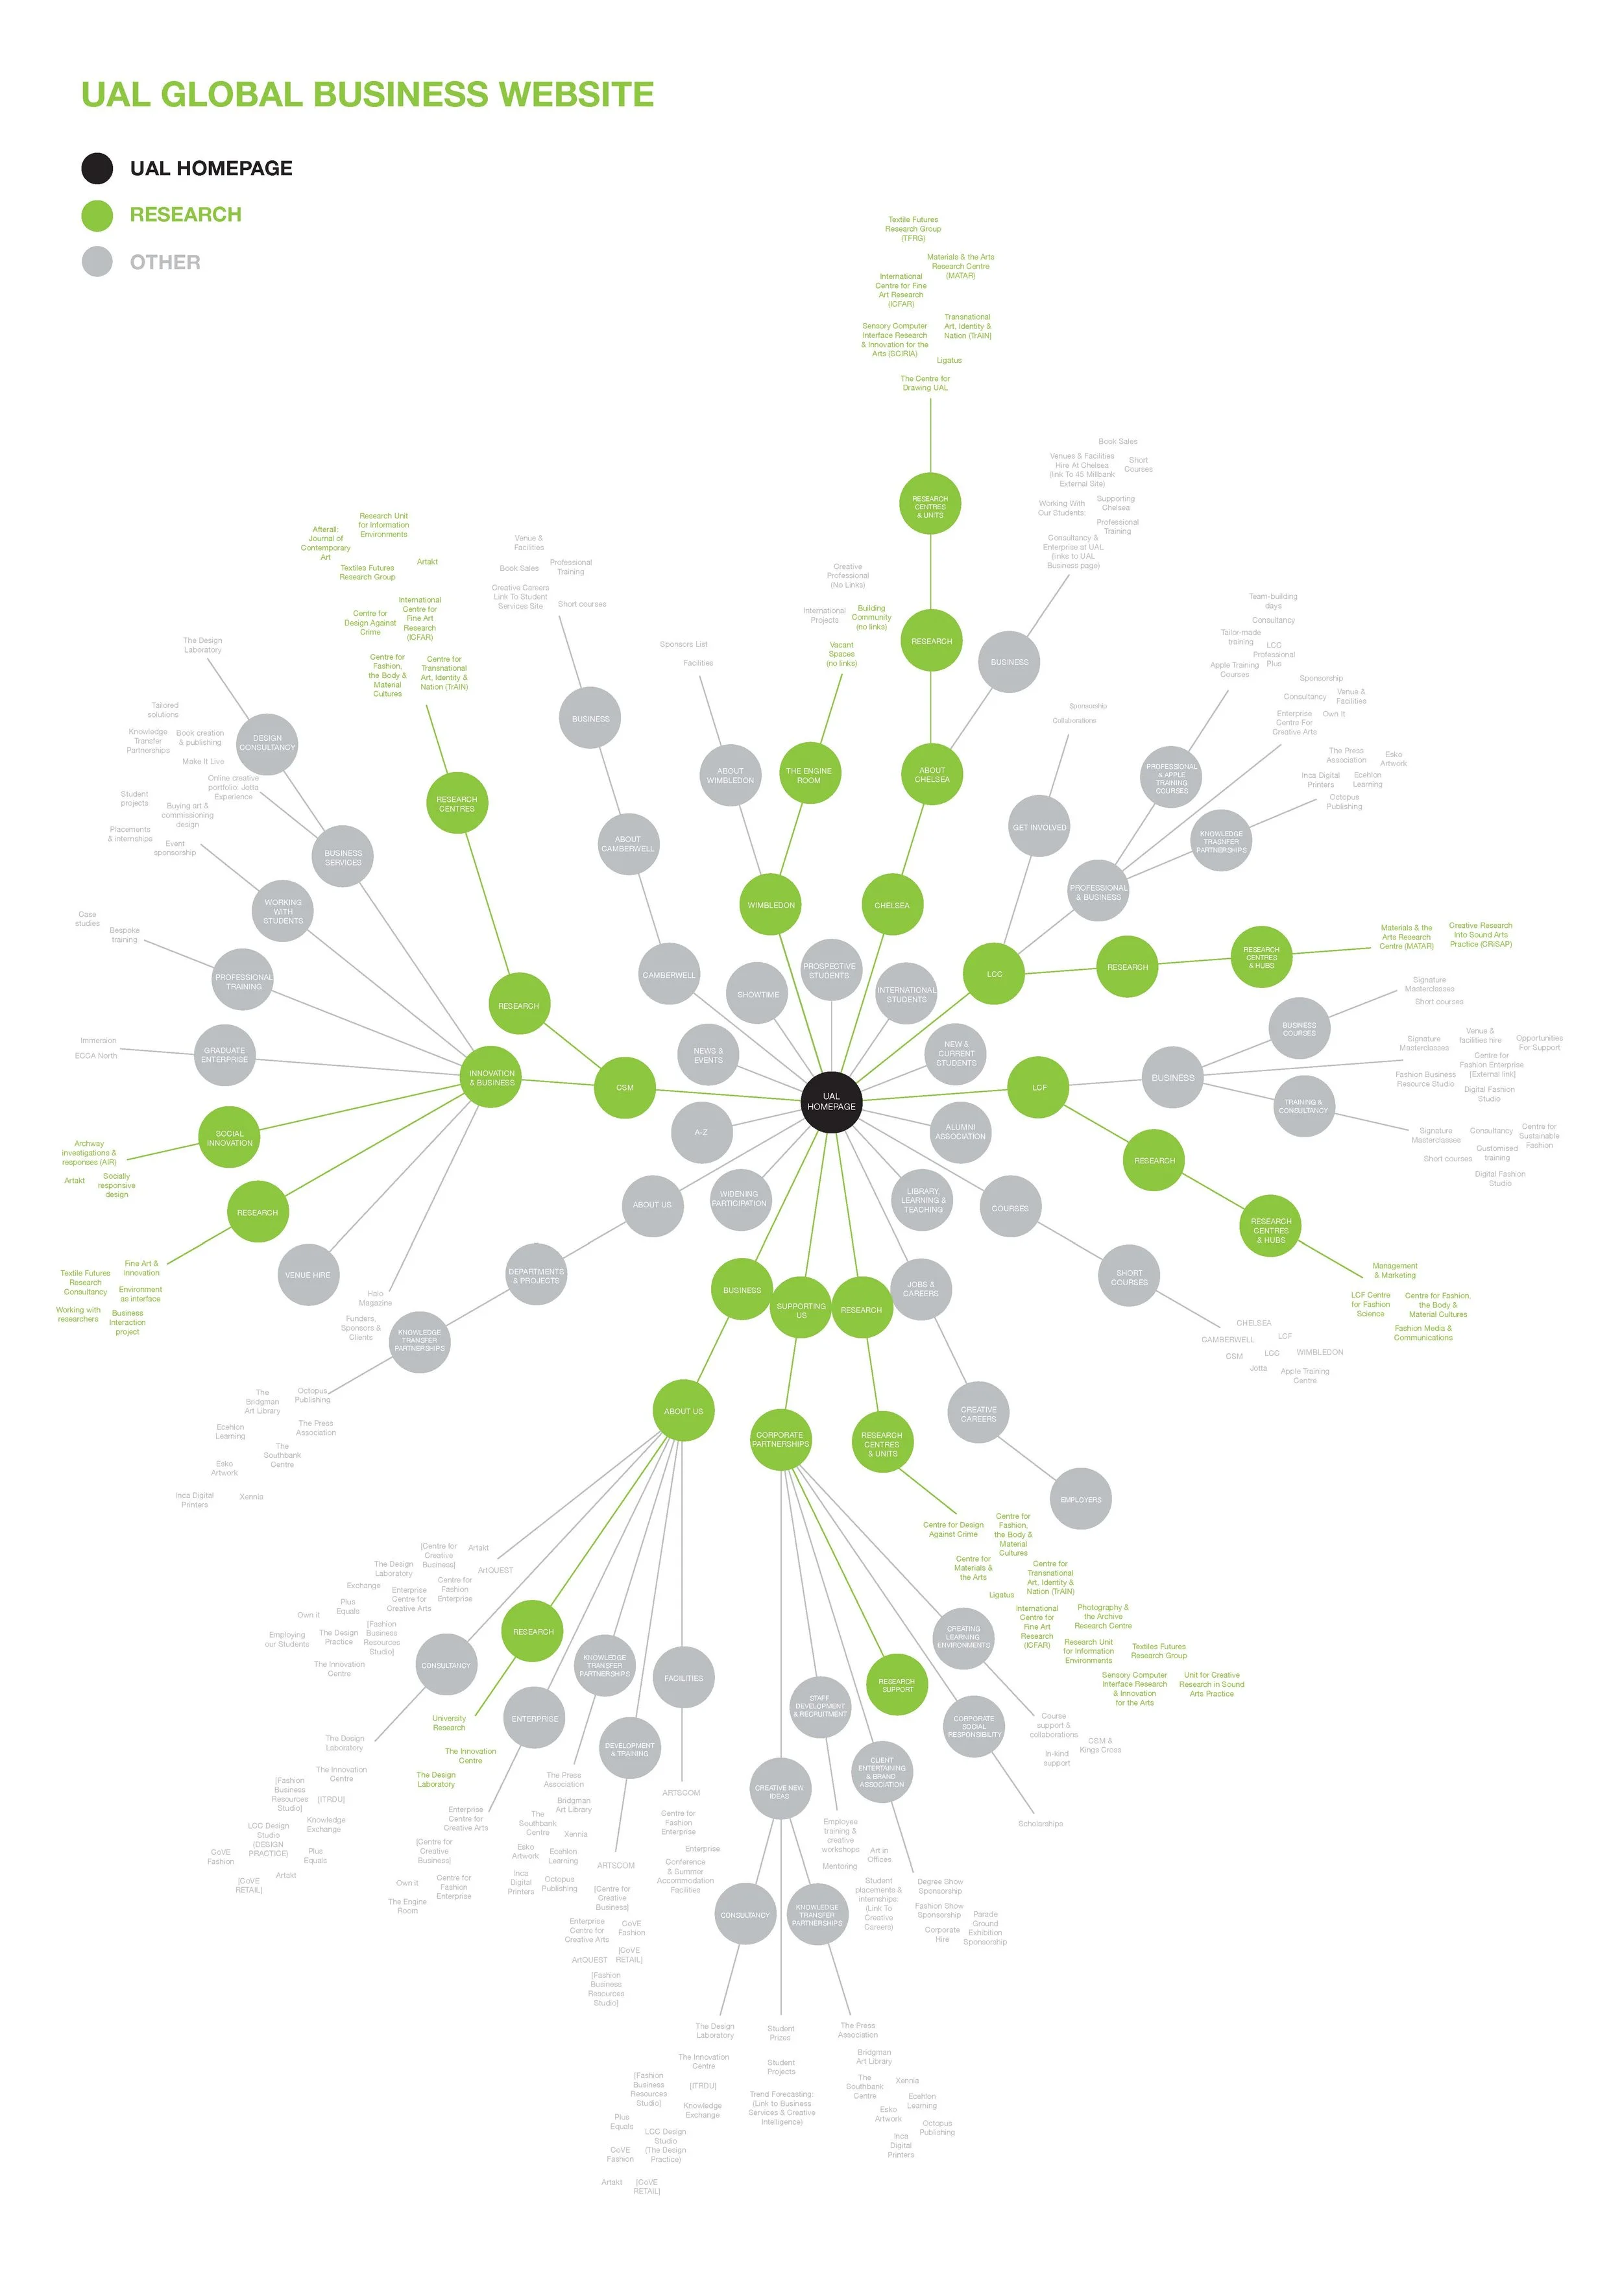
STAGE 2
Separating the categories
STAGE 3
Grouping the existing categories
STAGE 4
Eliminating repetition, creating a more streamlined and intuitive structure, and refining further


